Price Cycle Analysis, Explained: How the Cycle Screener Fits, Tests and Projects 688 Markets
Markets move in swings, and some of those swings come back at a fairly steady pace. Drawing one onto a chart after the fact is easy. Knowing whether it would have held up on prices it hadn’t seen is the hard part. The Price Cycle Screener fits a cycle model to each of 688 markets, freezes it at a cutoff, trades it through the following nine months after costs and projects its next turn. This guide walks through how that works, using the free E-mini S&P 500 (ES=F) model, and what the numbers can and can’t tell you.
In short
- A cycle model is up to six repeating rhythms found in a market’s daily closes and added together. It describes timing, when a swing has tended to turn, not how far price moves.
- Every model is fitted up to a training cutoff and then frozen. Its returns, trades and drawdown all come from the nine months after the cutoff, filled at the next open with 5 basis points of cost per side.
- The screener shows the best of 5,000 settings per symbol. That choice flatters the figures, so they describe a historical search, not an expected return. On ES=F, fewer than half of the 5,000 settings made money in the test.
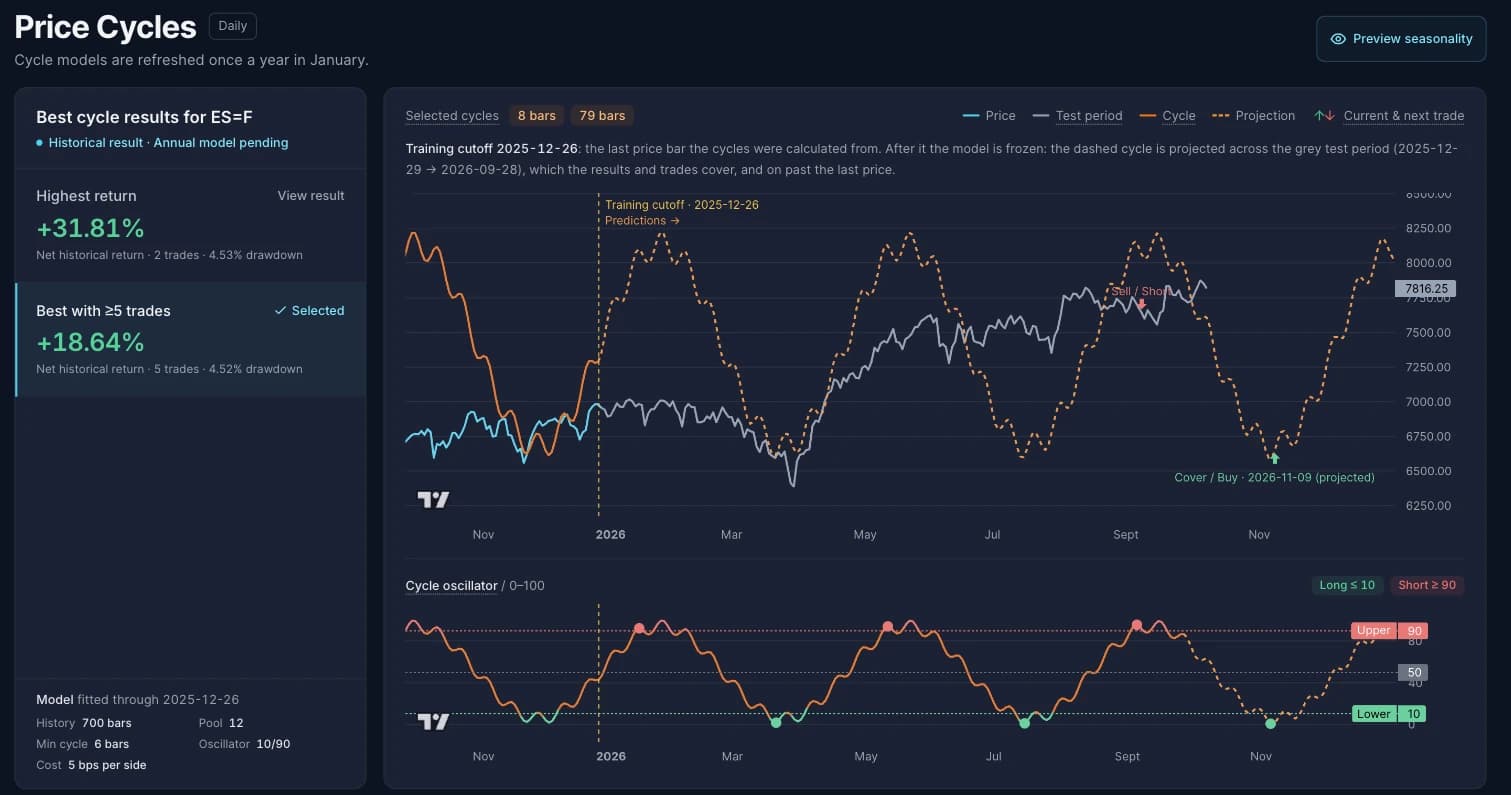
- ES=F’s model combined an 8-day and a 79-day cycle: five trades, three winners and +18.6% after costs with a 4.5% drawdown, while the contract itself rose about 11% over the same nine months.
- New: cycles meet seasonality. A Cycle aligned comparison shows how a seasonal window did in the years when the price cycle pointed the same way at entry.
Follow along in the free ES=F analysis, no account needed.
Cycles and seasonality in one place
Check the calendar and the cycle together
Does It Repeat shows which weeks of the year a market has historically risen or fallen, how consistently, and whether that pattern still holds up. With Pro, you can also see how it lines up with the market’s own price cycle.
Seasonality screener
FreeThe next yearly windows with a perfect record
- ICG.LICG PLCLongOct 21 → Nov 25 · won 10 of 10 years · +13.3% avg
- PHParker HannifinLongOct 21 → Nov 22 · won 10 of 10 years · +11.4% avg
- ODFLOld Dominion Freight LineLongOct 22 → Dec 2 · won 10 of 10 years · +9.0% avg
Price cycle screener
FreeCycle models with an entry in the next two weeks
- LITELumentum Holdings Inc.Shortentry Oct 29 · +302.9% net · 100% won
- XMR-USDMoneroLongentry Oct 27 · +278.2% net · 80% won
- AMDAdvanced Micro Devices Inc.Shortentry Oct 27 · +217.1% net · 80% won
Free account includes a screener preview, no credit card. Full access $20/mo at early-adopter pricing, 14-day money-back guarantee, cancel anytime. All statistics are historical; past performance does not guarantee future results.
What a price cycle is
Take a market’s daily closes and remove the long-run trend, and what’s left wobbles around zero. Some of those wobbles repeat at a fairly regular length: a dip and recovery that has tended to come back every 40 trading days, say, or a slower swing every five months. That length, counted in trading days or bars, is a cycle.
The analyser measures how strongly each cycle length shows up in the detrended prices and plots the result as a spectrum. The strongest lengths form a pool of candidates, and combinations of up to six of them are fitted together as smooth waves. Added up, they make the composite cycle drawn over the price chart. Because each wave keeps its own rhythm, the composite can be carried forward past today.
Two things follow from that. A cycle describes when, not how much: the projection shows when the fitted rhythm would turn, not where price will be. And it holds only as long as the past rhythm keeps repeating. Nothing in the model can know when a market stops behaving the way it did.
In the two years of ES=F prices before its cutoff, the strongest cycle ran about 79 bars, roughly 16 weeks, and repeated six times. It scored 91.9 on the Bartels test, a measure of how regularly a cycle has repeated, where higher means steadier.
From a cycle to trades
A cycle isn’t a trade until a rule says when to act. The analyser rescales the composite cycle into an oscillator from 0 to 100, and each model has two thresholds. A trough at or below the lower one opens a long, and a crest at or above the upper one opens a short. The turn is confirmed at the next close and filled at the following open, and each new signal reverses the open position, so once the first trade is on, the model is always long or short.
The test is deliberately plain. Each trade uses the whole account without leverage and pays 5 basis points on each side, and dividends and short-borrow fees are left out. The ES=F model uses thresholds of 10 and 90, so it waits for deep troughs and high crests.
Fitted on the past, tested on the next nine months
The most common way cycle analysis fools people is a wave fitted to the whole chart, including the part it is then judged on. Fitted that way, a wave will look good no matter what.
Every model here has a training cutoff. The cycles are fitted only on prices up to that date, and after it the model is frozen. The nine months after the cutoff are the test period, shaded grey on the chart, and every return, trade and drawdown on the page comes from those nine months. Three earlier three-month windows inside the training data decide how many cycles to combine, so even that choice is made before the test starts.
For the current ES=F model, the cutoff is December 26, 2025 and the test runs from December 29, 2025 to September 28, 2026.
ES=F, trade by trade
These are all five trades of the ES=F result with at least five trades. The turn is the day the oscillator turned; the trade fills at the open after the next close confirms it.
| Turn | Side | Entry | Exit | Entry price | Exit price | Return |
|---|---|---|---|---|---|---|
| Jan 15 | Short | Jan 20 | Mar 24 | 6,918.25 | 6,635.00 | +3.99% |
| Mar 20 | Long | Mar 24 | May 14 | 6,635.00 | 7,477.50 | +12.59% |
| May 12 | Short | May 14 | Jul 20 | 7,477.50 | 7,485.00 | -0.20% |
| Jul 16 | Long | Jul 20 | Sep 9 | 7,485.00 | 7,681.00 | +2.52% |
| Sep 4 | Short | Sep 9 | Sep 28 (open) | 7,681.00 | 7,746.75 | -0.96% |
| Compounded, after costs | +18.64% | |||||
Dates in 2026. The last short was still open when the test ended on September 28 and is marked at that day’s close.
Three of the five trades made money. Compounded, they returned +18.6% after costs, and the largest fall in daily equity along the way was 4.5%. The projected next turn is a trough around November 9, 2026, which would close the short and open a long. Projected dates are counted in trading days and don’t allow for exchange holidays.
For context, ES=F rose about 11% over the same nine months. That comparison flatters the model, for the reason two sections down.
Why every symbol has two results
Each symbol’s search saves two results. Highest return is the single setting with the best net return in the test. Best with ≥5 trades must also have at least five trades, a positive return and positive earlier validation, so it rests on more than one or two lucky rides.
ES=F shows why both exist. Its Highest return is +31.8%, from two trades: a short from January 30 to March 30 that made 8.7%, and a long opened on March 30 that was still running at the end of the test, up 21.3%. That setting made money in only one of its three earlier validation windows and lost 4.8% across them. The Best with ≥5 trades result is smaller, at +18.6%, but it was profitable in all three.
How to read the numbers
5,000 settings is a lot of chances to look good. For every symbol, the search tries 10 history lengths, 5 minimum cycle lengths, 5 lower and 5 upper thresholds and 4 candidate-pool sizes. On ES=F, 2,172 of those 5,000 settings finished the nine-month test with a gain, fewer than half, and the page shows the best of them.
No setting’s cycles were fitted on the test prices, but choosing the winner by its test result is still hindsight, and the more settings there are, the better the best one looks by luck alone. So the net return reads as how the best settings would have traded over those nine months, not as what to expect next. When comparing models, a few checks help:
- Best with ≥5 trades says more than Highest return. Two trades say very little.
- A model that also made money in all three earlier validation windows has a little more behind it.
- The drawdown and the trade list matter as much as the headline return. One long ride can carry a whole result.
- Simply holding the market over the same months is the benchmark that matters.
The Price Cycle Screener: every model in one table
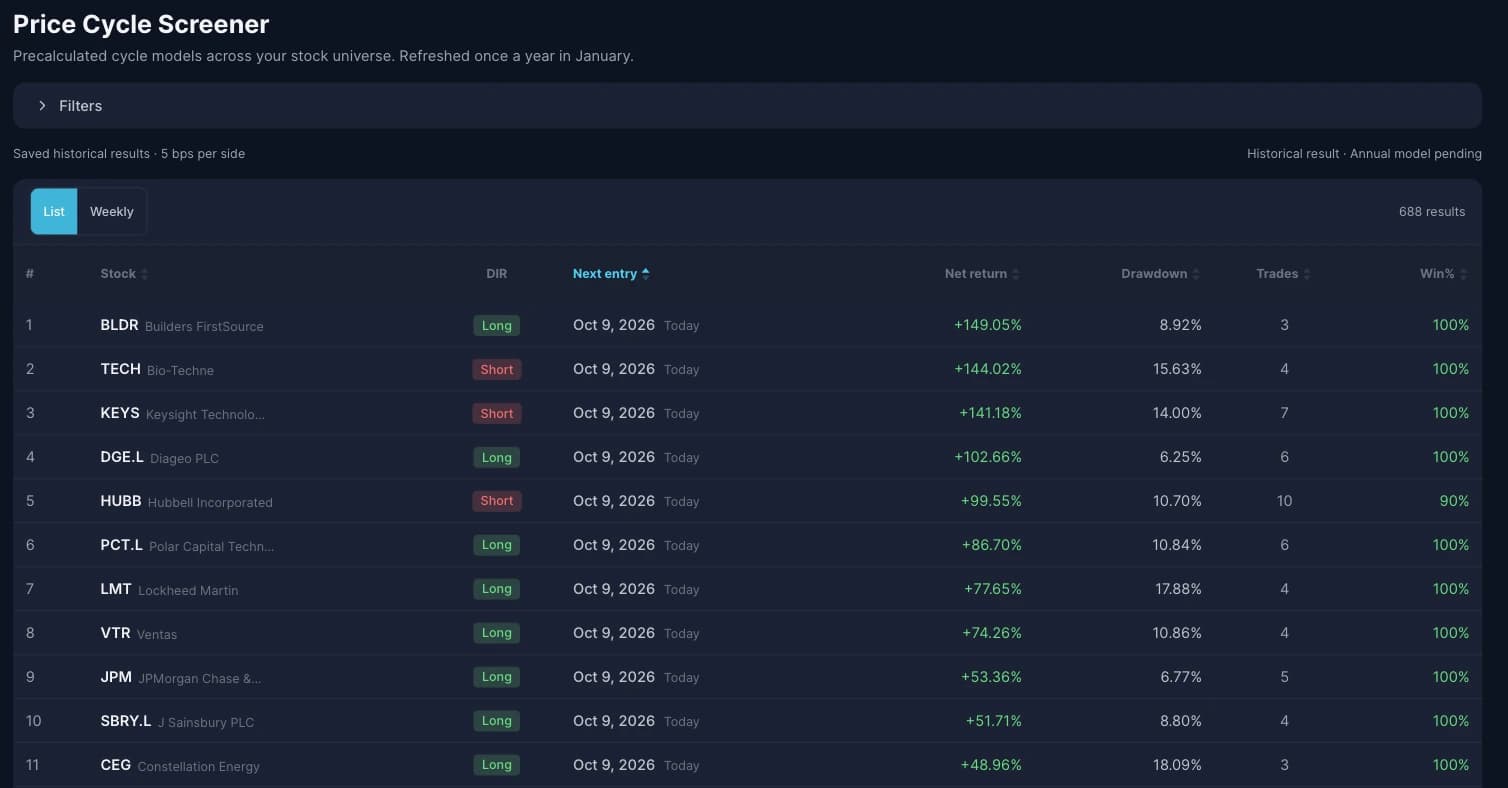
The screener lists the saved model for each of 688 symbols: stocks in the S&P 500, Nasdaq-100, Dow, DAX and FTSE 100 with enough daily history, plus major indices, index and commodity futures, currency pairs, Bitcoin and Ether. Each row shows the model’s next projected entry and its direction, with the net return, drawdown, trades and win rate from its test period.
The weekly view groups the models by the week their next projected entry falls in, and the list shows every one of them, sortable by any column. Filters narrow it by result type, direction, an entry window of 7 to 60 days, minimum net return and trades, profitable validation windows, maximum drawdown, index or market and market cap. Every row opens the symbol in the Price Cycle Analyser.
When the cycle meets the calendar
Does It Repeat started with seasonality: the weeks of the year in which a market has tended to rise or fall. A seasonal window opens on the same dates every year, but the market’s own price cycle can be rising or falling when it does. The newest addition puts the two side by side.
In the Seasonality Analyser, the Trade Filter Comparison now has a Cycle aligned column for Pro members. It takes the symbol’s current cycle lengths and, for each past year, refits them on the prices before that year’s seasonal entry. The year counts only if the refitted model was long at entry for a long window, or short for a short one. Entry and exit dates and returns stay the window’s own; the filter only decides which years count.
The Price Cycles page works the other way round. Preview seasonality takes today’s cycle position, follows it to the next seasonal peak or trough and runs the same comparison on those calendar days, without leaving the page.
Trade Filter Comparison
BLDR · Long · 10 years
| Metric | All trades | Williams A/D | EC HOT only | Cycle aligned |
|---|---|---|---|---|
| Trades | 10 | 6 | 0 | 4 |
| Win Rate | 30% | 50% | — | 75% |
| Avg Return | -1.46% | -0.27% | — | +0.72% |
| Total Return | -14.63% | -1.62% | — | +2.87% |
| Compounded Equity | $861 | $983 | — | $1,029 |
| Max Win | +2.21% | +2.21% | — | +2.21% |
| Max Loss | -5.52% | -2.68% | — | -1.06% |
Cycle filter method · Current cycle, historical refits · 10/10 entries covered
Four trades is a small sample: one year moves the win rate by 25 points. The cycle lengths also come from today’s model, chosen with prices from after most of those entries, so the comparison is retrospective. And the filter doesn’t improve every window; on some, the years it skips are the good ones. It shows whether the season and the cycle have tended to agree for one market, not a rule that makes a pattern work.
What it can’t tell you
- Models change once a year. They are recalculated each January from prices through December 31. Newer closes extend the chart but never change the model, its trades or its projection. Until the first annual run, the pages show the latest saved run as a historical result.
- The projection is timing, not a target. It shows when the fitted rhythm would turn, and its dates don’t allow for exchange holidays.
- Nine months is a short test. Most models trade only a handful of times in it, so a single trade can swing the result.
- Costs are simplified. 5 basis points per side, with no further slippage, dividends or borrow fees.
- Rhythms stop. A cycle that repeated for two years can fade without warning, and the model has no way to see that coming.
Try it
Two models are open to everyone without an account: E-mini S&P 500 futures (ES=F) and Apple (AAPL). The public cycle screener preview lists the top setups opening in the next two weeks. The full Price Cycle Screener, every other symbol and the Cycle aligned seasonality comparison are part of the Pro plan.
More on each tool: the Price Cycle Screener and the Price Cycle Analyser.
Common questions
What is a price cycle in trading?
A rhythm that repeats in a market’s prices, such as a swing that has tended to recur about every 40 trading days. The Price Cycle Analyser measures which cycle lengths have been strongest in a market’s detrended daily closes and fits up to six of them together. A cycle describes timing in past prices; it is not a price target.
How does the Price Cycle Screener test a cycle model?
Each model is fitted on prices up to a training cutoff and then frozen. Its results come from the nine months after the cutoff: a trough at or below the lower oscillator threshold opens a long, a crest at or above the upper threshold opens a short, and each turn is filled at the open after the confirming close, with costs of 5 basis points per side.
Are the returns in the Price Cycle Screener what to expect next?
No. Each symbol’s result is the best of 5,000 settings in the same nine-month test, and picking the best of many flatters it. On ES=F, 2,172 of the 5,000 settings made money over that period. The figures describe a historical search, not an expected return.
How often are the cycle models updated?
Once a year, in January, from prices through December 31. Opening a page never runs a new search; newer daily closes are drawn on the chart without refitting the model or changing its trades or projection.
Can price cycles be combined with seasonal patterns?
With the Pro plan, the Seasonality Analyser’s Trade Filter Comparison has a Cycle aligned column. It counts only the past years in which the symbol’s price cycle, refitted on prices before each entry, pointed the same way as the seasonal window. Because the cycle lengths come from today’s model, it is a retrospective comparison, and it often rests on few trades.
Can I try the Price Cycle Analyser for free?
Yes. The full analysis for E-mini S&P 500 futures (ES=F) and Apple (AAPL) is open to everyone, without an account, and a public preview lists the top cycle setups opening in the next two weeks. Every other symbol is part of the Pro plan.
More on Cycles
Cycles and seasonality in one place
Check the calendar and the cycle together
Does It Repeat shows which weeks of the year a market has historically risen or fallen, how consistently, and whether that pattern still holds up. With Pro, you can also see how it lines up with the market’s own price cycle.
Seasonality screener
FreeThe next yearly windows with a perfect record
- ICG.LICG PLCLongOct 21 → Nov 25 · won 10 of 10 years · +13.3% avg
- PHParker HannifinLongOct 21 → Nov 22 · won 10 of 10 years · +11.4% avg
- ODFLOld Dominion Freight LineLongOct 22 → Dec 2 · won 10 of 10 years · +9.0% avg
Price cycle screener
FreeCycle models with an entry in the next two weeks
- LITELumentum Holdings Inc.Shortentry Oct 29 · +302.9% net · 100% won
- XMR-USDMoneroLongentry Oct 27 · +278.2% net · 80% won
- AMDAdvanced Micro Devices Inc.Shortentry Oct 27 · +217.1% net · 80% won
Free account includes a screener preview, no credit card. Full access $20/mo at early-adopter pricing, 14-day money-back guarantee, cancel anytime. All statistics are historical; past performance does not guarantee future results.